


Webinar Recap: Managing Energy Data from End to End
Amy Hou | September 21, 2018 | Energy & Sustainability
In our recent webcast hosted with Smart Energy Decisions, Urjanet’s Tim Porter sat down with Fortune 500 manufacturer Arconic energy sourcing manager, Steve Frank, to hear how their team built a single source of truth for energy data from supply chain to end use. If you weren’t able to join us live, we’ve got you covered — here’s a recap.
To hear Tim and Steve’s full insights, watch the replay here.
Building blocks of energy data management
To start off, Tim took us through the fundamentals of energy data. When people talk about “energy data,” they’re typically referring to these three building blocks: utility invoice data, whole building interval data, and real-time submeter data.
- Utility invoice data: provides insight into month-over-month consumption, cost, demand, tariff, and charge information
- Whole building interval data: records granular usage information in set intervals, typically 15 minutes to an hour, and reported next day
- Real-time submeter data: enables extremely granular insights, recorded in minute or second intervals, and reported in real time
Webinar: Managing Energy Data from End to End from Urjanet
Each type of energy data varies in granularity as well as ease of access. Utility invoice data, as Tim describes it, is one of the core tenets of energy management. It provides a substantial amount of information at a monthly level on consumption and associated costs. It’s also fairly accessible — everyone has a utility bill.
Whole building interval data, on the other hand, helps identify patterns in how the whole building is performing every day. It can be slightly harder to access, but where the utility has installed a smart meter, the utility can make it available. Finally, the most granular and most difficult to access is submeter data.
Submeter data is valuable for pinpointing usage of certain areas of a building or certain sets of equipment: a parking deck, data center, or HVAC system. It provides real-time visibility, but it comes at a fairly high cost of installing submeters.
Attendees chime in
During the live webinar, we polled the attendees, many of whom are likewise responsible for energy data management at the world’s largest corporations. The vast majority have, at the very least, gotten started analyzing their energy data, but a substantial number are still doing so manually.
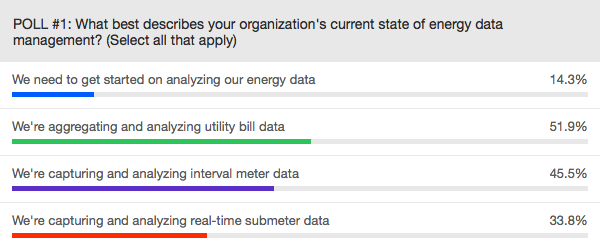
The spread of energy managers who are making use of each type of energy data correlates directly with the level of difficulty involved in accessing that data. As Tim phrased it: “As you go up in the granularity of data that’s available, you’re also going up in how hard it is to get to. Everybody has a utility bill, so it’s not surprising that over half are looking at utility bill data.” On the other end, it’s not surprising that submeter data has the lowest penetration, given that installing submeters produces the highest barrier to entry.
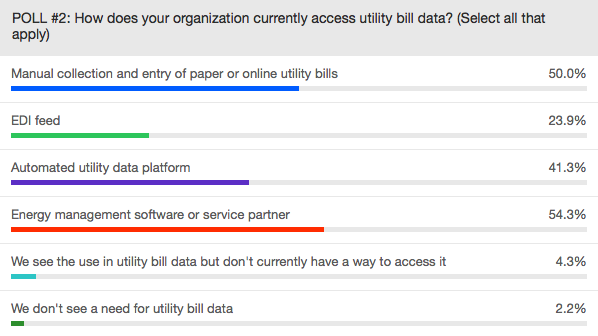
Of those who are looking at utility bill data, most are either collecting it manually or through an energy management software or service partner. By far the smallest group are those who don’t see any need for utility bill data at all. Of course, some could rely more heavily on interval data or submeter data in place of it.
Only 2.2 percent don’t see a need for utility bill data in energy management.
Creating a single source of truth
Most of the energy managers who joined us are engaging with some combination of these three building blocks. In order to really get a handle on consumption and cost, however, all three data sources need to be consolidated. Centralized energy data enables energy managers to:
- Improve energy transparency
- Automate recurring tasks
- Enhance collaboration across departments
- Achieve cost savings
That said, it’s a daunting problem to tackle, with different submeters, invoice formats, utility providers, countries, and more. There’s a lot of complexity that goes into the goal of achieving a single source of truth. So, how did Arconic manage to do it?
One of their first steps was finding Urjanet as a source of whole building interval meter data. Said Steve: “Historically, we had relied too much on invoice-only data or even manual data collection. Teams would walk around our plants and get individual meter read data, writing it on clipboards, putting it in Excel spreadsheets. It was a very manual, very time-consuming process.”
“By integrating with Urjanet, it allowed us to create that single source of truth,” said Steve. Arconic also partnered with a group called Cotopaxi. With Urjanet data flowing into Cotopaxi’s Strata system, their team built a one-stop shop for energy data and reporting, helping them step up their game from energy management to energy intelligence.
Arconic realizes results
Through the use of these systems, Steve’s team saw quick wins. At one facility, they achieved $13,000 in savings in just one month. Arconic had a contract in place that limited their gas consumption to a certain level. Every time they went over the limit, they were hit with an overage fee. In the past, they didn’t realize they went over the limit until they got the invoice the next month. With the Strata tool, they were able to set up alerts within the system when they were approaching the limit. Now, they can proactively reach out to the utility, make adjustments mid-month, and achieve significant savings.
At one facility, they achieved $13,000 in savings in just one month.
With interval meter data from Urjanet coming into the system, Steve’s team can also proactively plan for spikes in demand. Steve described a common scenario: “Let’s say we notice a spike coming up at a particular time of the month, every month. Maybe our monthly peak demand charge is set on the first Monday of every month. This tool allows us to really dig into that and understand what’s happening on that one day of the month. What piece of machinery is firing up at that particular moment? Oftentimes, the demand charges are a very high portion of your bill. So being able to identify what that demand charge is and know where it’s coming from within the facility, you can then take action and avoid those high charges.”
To hear the interactive Q&A, check out the replay here. If you were able to join us and didn’t get your questions answered, let us know, and we’ll put you in touch with the right person.
You may also like:
If you like what you’re reading, why not subscribe?

About Amy Hou
Amy Hou is a Marketing Manager at Urjanet, overseeing content and communications. She enjoys writing about the latest industry updates in sustainability, energy efficiency, and data innovation.
You May Also Like
Support Business Continuity by Embracing ESG
Honor Donnie | March 18, 2022 | Energy & Sustainability