


Extract Energy Insights with Data Calendarization
Amy Hou | July 10, 2018 | Energy & Sustainability
What are utility bills? In their most basic format, they list a time period, how much of a given utility you’ve used during said period, and how much you’re being charged for that usage. The trouble is, that time period is often a month or longer – and, more often than not, consecutive time periods overlap. Moreover, different utility providers collect and present utility bill information differently. Together, these factors make it surprisingly difficult to read into your monthly utility bills and accurately map your utility bill data to calendar days.
Enter: data calendarization.
What is data calendarization?
Data calendarization is the process of normalizing utility bill data to accurately fit to a calendar month, empowering energy analysts to draw deep insights from otherwise opaque bills. It involves a few steps and a good deal of close analysis. Let’s dive into an example to demonstrate the steps needed to turn utility bill data into a clean set of average daily energy use values.
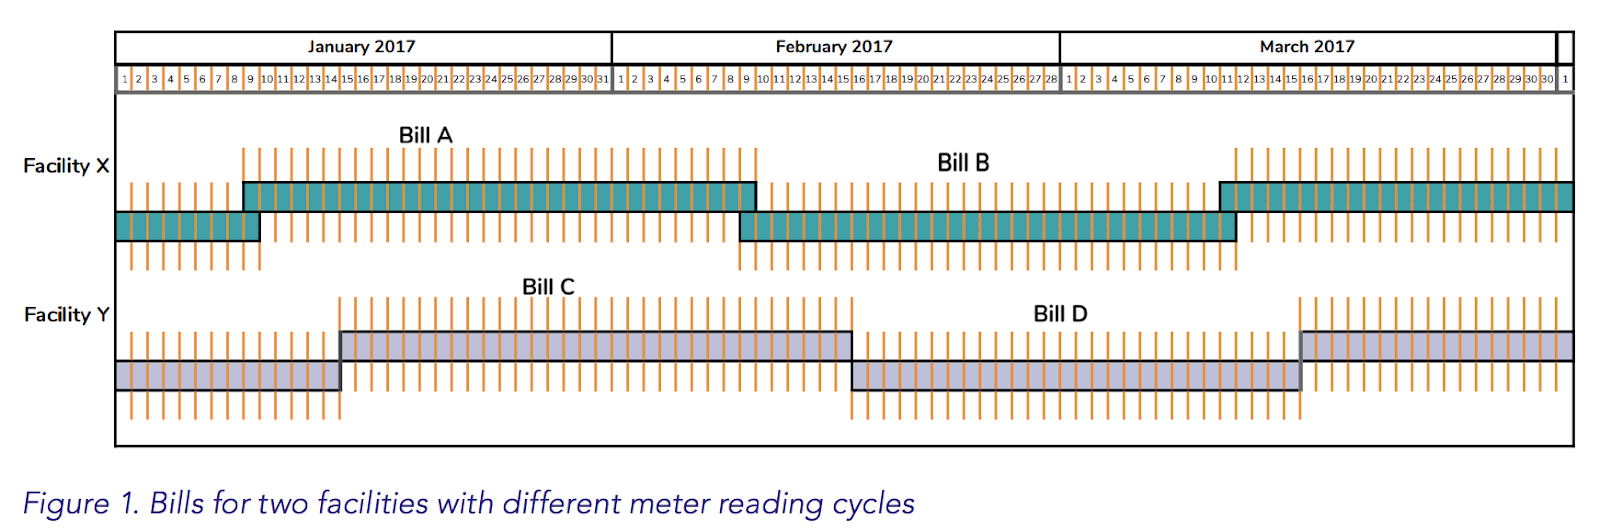
Facility X and Y, in the graph above, represent two buildings drawing their electric power from different electric providers. A couple of things stand out right away. First, the “monthly” bills each facility receives don’t correspond to calendar months – each bill is staggered across two months. Second, notice that Facility X’s bills overlap: Bill A’s start date is the same as Bill B’s end date. Facility Y’s bills, however, do not overlap.
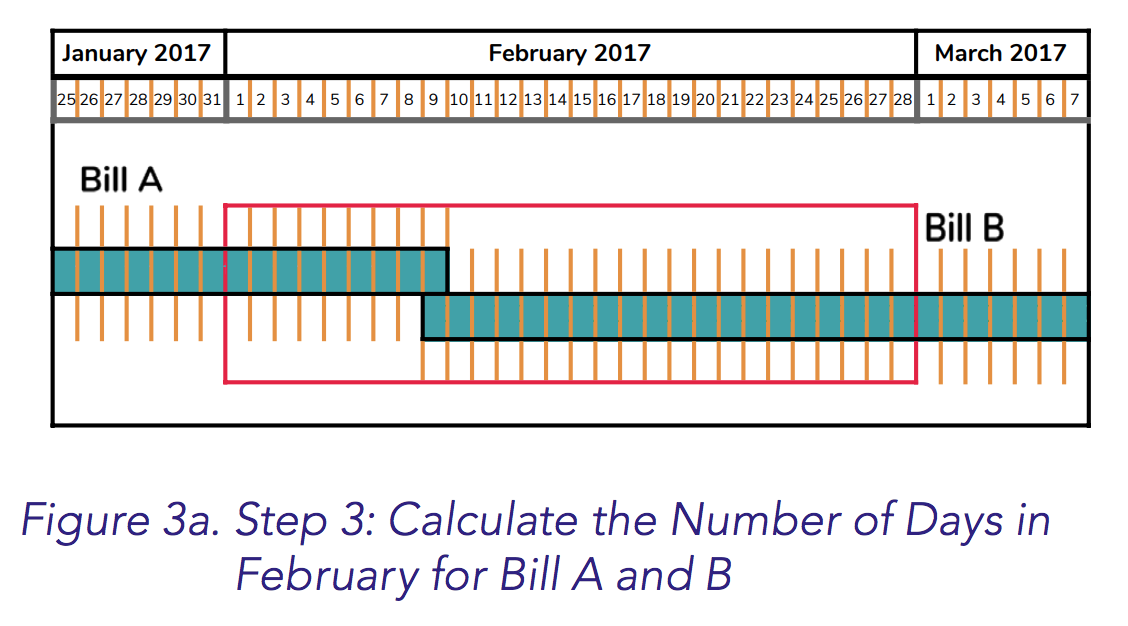
The goal of calendarization is to turn this inconsistent bill data into a normalized daily and monthly energy use picture, symbolized by the red box in the figure below.
Why does it matter?
Forming a normalized monthly energy use picture keeps analysis consistent and accurate. Energy analysts need a reliable baseline of average daily use data to measure the impacts of retrofits, system updates, or new energy management programs. Without that data, changes in usage become difficult to measure confidently.
The inconsistencies in bill presentment from provider to provider introduce error into energy analysis programs that, if unaccounted for, can significantly skew daily or monthly energy use projections. Failure to recognize overlapping billing periods, for example, can skew daily energy use estimates by ±three percent – a significant enough deviation to obscure meaningful energy management insights.
Ready to learn more?
Calendarizing your utility bill data can be a tricky process. It requires careful, critical analysis of each utility account and time-consuming, error-prone numerical transformation of billing amounts and date ranges. Luckily, Urjanet’s got you covered. Part four of our Utility Data Guru series, A Guide to Data Calendarization, shows you exactly how to calendarize your utility bill data so you can focus on what matters most: keeping your business lean, energy efficient, and profitable.
Click here to download Utility Data Guru Series, Part 4: A Guide to Data Calendarization. And if you’re ready to see how Urjanet’s Automated Utility Data Platform can take your energy management program to new heights, contact us today.
Related Resources:
If you like what you’re reading, why not subscribe?

About Amy Hou
Amy Hou is a Marketing Manager at Urjanet, overseeing content and communications. She enjoys writing about the latest industry updates in sustainability, energy efficiency, and data innovation.
You May Also Like
Support Business Continuity by Embracing ESG
Honor Donnie | March 18, 2022 | Energy & Sustainability