


The Duck Curve: Quacking the Case
Urjanet Inc | August 18, 2016 | Energy & Sustainability
While the outdoor temperature might not reflect it, for many people, summer has come to an end. What are we referring to? The start of the academic year. Come mid-August to September, students from across the nation are finding themselves back in the classroom, regardless of how many Pokemon they have left to catch. Furnished with new backpacks and new wardrobes, they are ready to take on the school year. But are you? Let’s take a look at one trend heavily impacting today’s energy landscape.
Today’s classroom topic: the Duck Curve.
Late last year, the California Independent System Operator (CAISO) issued a report accentuating how solar power and other renewables are not cooperating with the demand for electricity, which brings trouble to the playground. This phenomenon was illustrated through a graph resembling the profile of a duck. Fundamentally, the figure depicts a net load curve on a sunny spring day for years 2012 to 2020 with a y-axis representing the megawatts the system operator must meet and a x-axis showing the hours of a day.
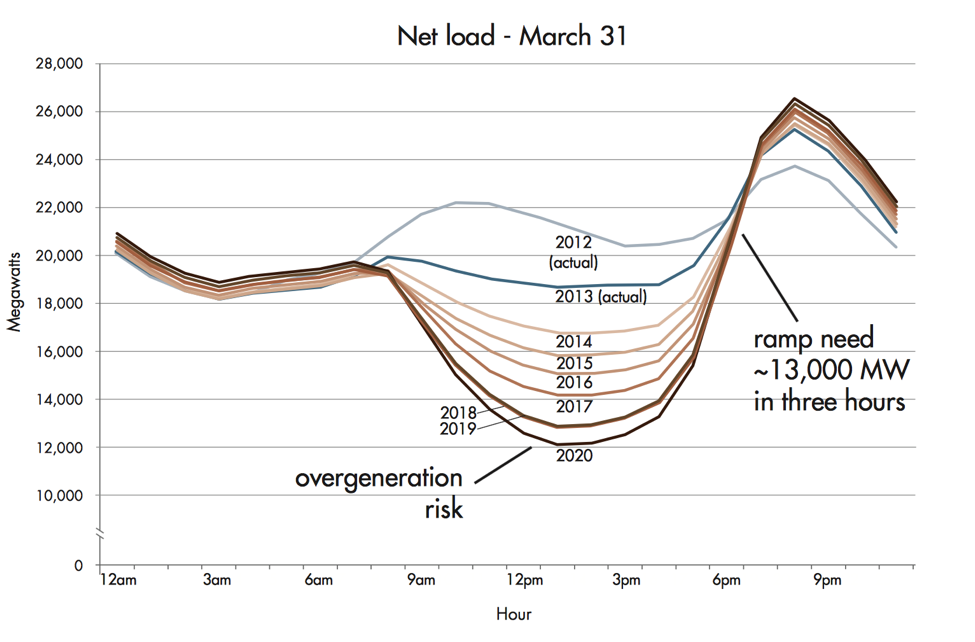
Image courtesy of California ISO
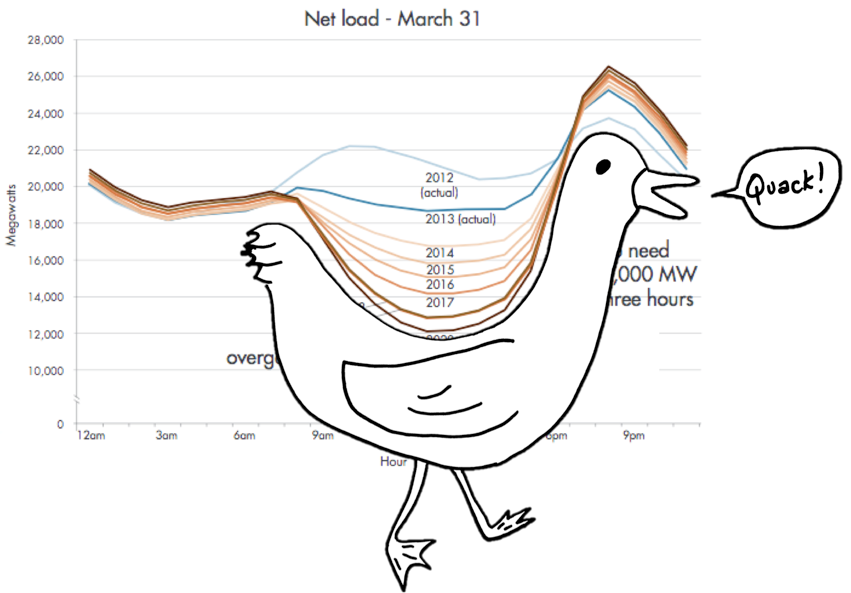
Image courtesy of California ISO / Jordan Wirfs-Brock
The rising prominence of solar and distributed energy generation is transforming the load shape of the grid and correspondingly the net load curve. Imagine a topographic map from your high school geography class. The traditional afternoon peak in energy consumption is turning into a deep valley when sunlight and solar generation is greatest. Then, towards late afternoon, when solar energy generation drops and you return from work and your children from school, residential energy consumption peaks quickly and dramatically.
So, the problem with this seemingly harmless image — prepare to transition into anatomy class — is the belly of the duck. Our energy grid was constructed factoring in a baseline level of electricity generation from power plants, typically natural gas and coal. After sitting idle throughout the day, these power plants are not able to respond quickly enough to the peak in energy demand that occurs late in the afternoon. These plants are also not equipped to turn on and off throughout the span of one day, and it is highly expensive and pollutive to do so. Consequently, utilities are turning to flexible yet costly energy sources, such as nuclear and gas, to satisfy this hike in demand and climb the neck of the duck.
Exacerbating this predicament is the fact that the duck is getting fatter — someone has been skipping gym class. As renewable energy becomes more efficient and constitutes a larger portion of total energy load, the duck’s belly approaches bottom, which means net load is getting alarmingly close to zero. If net load sinks into the negative range, the grid will begin to reject power (curtailment), and this backfeed could compromise grid stability and overwhelm generating capacity.
In essence, this duck is wreaking havoc for grid operators who like predictable and manageable energy loads. However, unlike in Calculus class, this is not a problem without any solutions — storage technology, natural gas, energy efficiency, demand response, and new import and export capabilities all hold promise, according to several sources including the Rocky Mountain Institute. But in order for these solutions to be effective, consumers and utilities alike need to know when and where their energy is being generated and consumed. This is where data comes into the picture.
The Duck Curve can be solved for with accurate and timely data about buildings and energy use. Specifically, by leveraging interval data, you can understand your hourly electric, water and gas consumption, make informed decisions, and flatten the dramatic peaks and valleys that characterize the infamous duck. This will enable you to concentrate your energy efficiency initiatives during times when grid demand is highest. Data lends to transparency, and transparency will be the key to effective energy management strategies and cost savings, and ultimately a reliable energy grid.
In closing of today’s lesson, ready yourself for the school year and the change in your energy consumption that comes along with it. Similar to preparing for a test, as long as you utilize your tools and your data, you can train the duck and quack the case.
Looking for more information? Our data experts are here to help.
Related Resources:
- A Day in the Life of a Sustainability Professional
- Top 3 Organizations Driving Corporate Energy Reduction
- Announcing: Urjanet Utility Interval Data
If you like what you’re reading, why not subscribe?

About Urjanet Inc
Urjanet, the global leader in utility data aggregation, simplifies how organizations access and use utility data, enabling them to focus on their business. Our technology collects, processes, and delivers data from over 6,500 electric, natural gas, water, waste, telecom, and cable utilities worldwide.
You May Also Like
Support Business Continuity by Embracing ESG
Honor Donnie | March 18, 2022 | Energy & Sustainability